Using PERT View
PERT functionality renders on-demand diagrams that show job dependency relationships. These visualizations can be accessed from the Processes page in the Operations module.
PERT View in Solution Manager
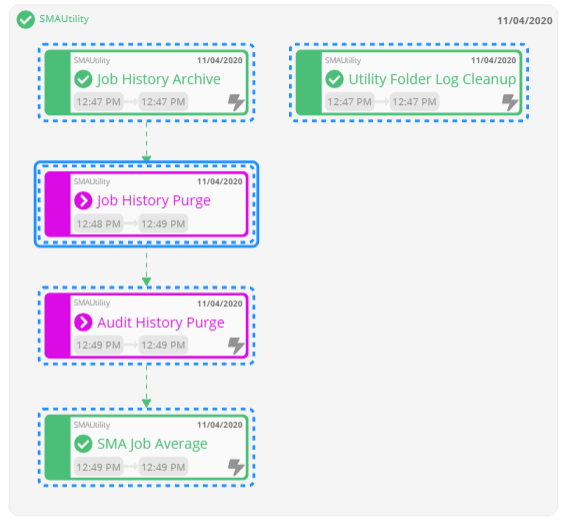
PERT View Tips
Here are things to keep in mind when using PERT View in Solution Manager:
Use the Refresh button to refresh the data and update the PERT representation.
Use the Auto-refresh toggle switch to control auto-refreshing of the PERT diagram. When enabled, any structural changes to the diagram are detected and the view is automatically refreshed (if not manually refreshed by users).
Simultaneously press the Ctrl key and scroll the mouse wheel up or down for zooming capability on the diagram.
A dashed royal blue border will appear around nodes in the diagram to indicate what was originally selected (i.e., jobs or schedules) for visualization.
The color of each node in the diagram is dependent upon the underlying job's current job status, as indicated below:
- Green - Indicates the underlying job has a status of Finished OK.
- Black - Indicates the underlying job has a status of Cancelled.
- Magenta - Indicates the underlying job has a status of Skipped.
- Orange - Indicates the underlying job has a status of Missed Start Time.
- Red - Indicates the underlying job has a status of Failed.
- Gray - Indicates the underlying job has a status of Qualifying.
- Turquoise - Indicates the underlying job has a status of Held.
Tooltips are available for Status and Alert icons within nodes in the diagram.
Hovering over a node in a diagram will display a tooltip with black background that includes any documentation relating to the job and frequency of the selected job (as shown in the graphic) in the bottom portion of the tip. Only the first eighty (80) characters of the documentation will be displayed. If no documentation is available, the bottom portion will appear empty, as indicated by the dash (-) character.

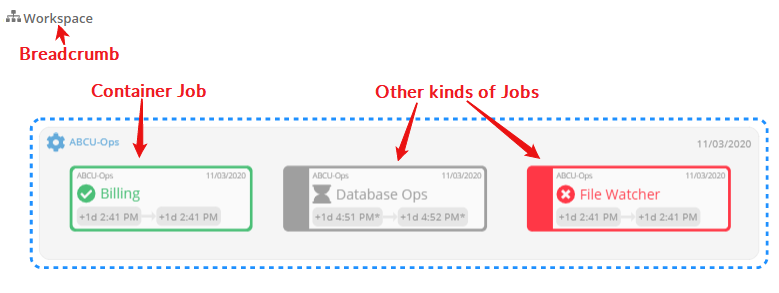
Nodes that represent Container jobs are stylistically different from other nodes in the layout (as shown in the graphic). When hovered on a Container job, the cursor appears as a hand to indicate drill-down capability to view any associated subschedule(s). After drilling down into subschedule information, click on any segment of the breadcrumb (which will show the navigation path) at the top-left to navigate to previous views.
Enable the Include Thresholds/Resources switch ()
to display threshold and resource dependencies in the PERT diagram, as
shown in the graphic. When hovered on the dependency line, the required
value of the dependency is displayed as a tooltip.
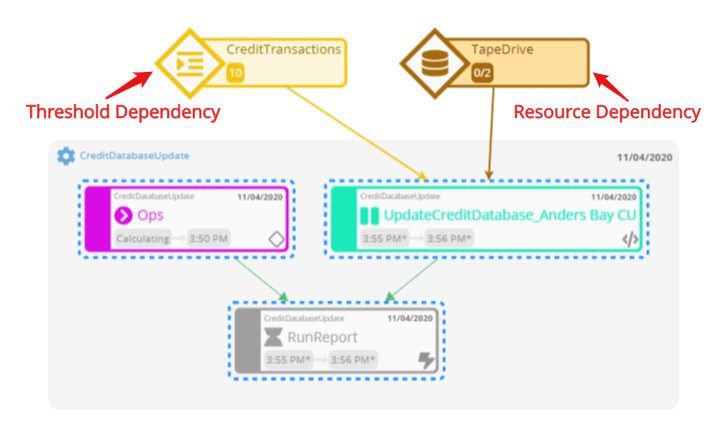
- When hovered over a resource dependency line, the tooltip displays the number of resources the job requires.
- When hovered over a threshold dependency line, the tooltip displays the numeric value for the threshold. This value will contain one of the following valid operators: equal (=), greater than (>), less than (<), greater than or equal to (≥), less than or equal to (≤), not equal (≠).
Within nodes, these icons represent the following:
- Indicates that there are threshold/resource updates associated with underlying Daily jobs. When hovered over the icon, the associated update is displayed as a tooltip.
- Indicates that there are OpCon Events associated with underlying Daily jobs. When hovered over the icon, the associated event is displayed as a tooltip.
- Indicates that there are expression dependencies associated with underlying Daily jobs. When hovered over the icon, the associated expression dependency is displayed as a tooltip.
- Indicates that there is a required dependency missing. When hovered over the icon, the number of required dependencies missing is displayed as a tooltip.
If the diagram is extremely complex (e.g., has many jobs or nodes or dependencies), the representation will be rendered with a simplistic layout.
PERT View Access
To access PERT View:
Click on the Processes button at the top-right of the Operations Summary page. The Processes page will display.
Ensure that both the Date and Schedule toggle switches are enabled so that you can make your date and schedule selections, respectively. Each switch will appear with a green checkmark when enabled.
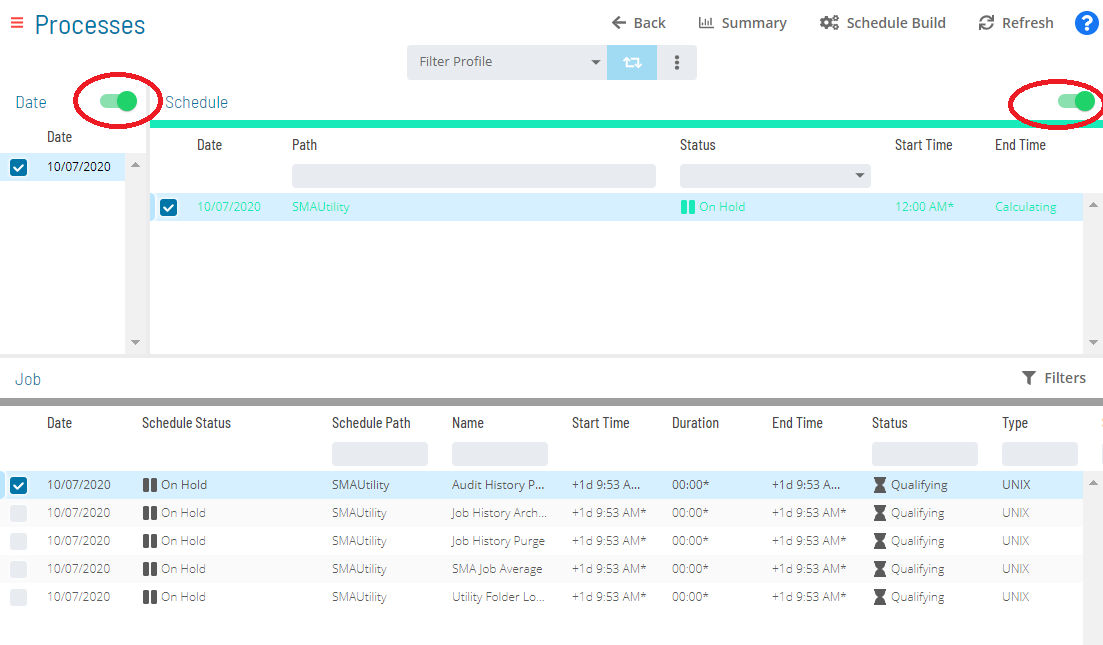
Select the desired date(s) to display the associated schedule(s).
Select one or more schedule(s) or job(s) in the perspective list.
Right-click on the selected schedule(s) or selected job(s) to display the Selection panel.
Select the Diagram accordion-style tab in the panel.
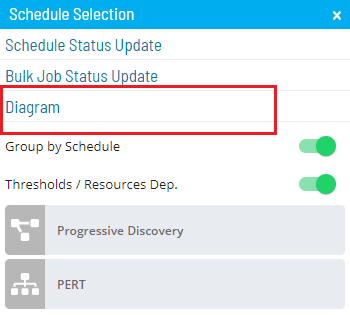
Enable the Group by Schedule switch ()
to group or organize the workflow by schedule. If Group by Schedule
is disabled, the jobs will be integrated in the diagram.
- Enabling the Group by Schedule switch also displays a Schedule Status indicator and tooltip near the schedule name at the top-left-corner of the PERT diagram in order to provide you with enough information to take appropriate actions at any given time.
Select one of the following options depending on the schedule/job selections:
PERT: This option displays the individual jobs and job dependency relationships for a schedule.
The PERT action will display all jobs and job dependency relationships for the selected schedule(s) whereas the Dependency Chain, Predecessors, or Successors action on the job(s) will display only the jobs related to the original selection.
When PERT is requested for a schedule, the cross-schedule dependencies will also be displayed in the diagram. If the Group by Schedule option is enabled, then only the predecessor jobs from other schedules will be displayed in the workflow.
Isolate Dependency Chain: This option displays the entire dependency chain (e.g., is preceding the critical path and subsequent jobs).
Isolate Predecessors: This option displays all preceding jobs in a dependent chain.
Isolate Successors: This option displays all subsequent jobs in a dependent chain.
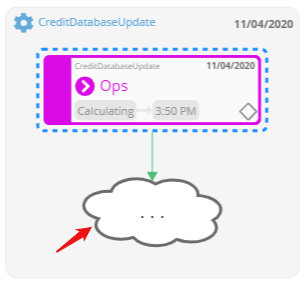
Progressive Discovery: This option displays a more focused view of dependency relationships for real-time impact analysis by quickly drawing the direct relationships of a selection, which performs better than requesting complete dependency graphs on large and complex workflows. Essentially, Progressive Discovery is an option on job and schedule selections that first loads the current selection and shows the direct (level 1) predecessor and successor jobs for the given selection. In Progressive Discovery mode, the diagram shows cloud shapes (as shown in the graphic) to highlight that the displayed job has predecessor/successor trees on the next level. Click on a cloud shape in the diagram to expand on the preferred level then iteratively expand and discover more levels. Progressive Discovery will also display the cross-schedule dependency as part of the possible predecessor- and successor-level trees.
- Selecting then right-clicking on a threshold dependency in the PERT diagram while in Progressive Discovery mode will display the Selection panel. Once the panel is displayed, you have the option to look up and dynamically add dependent jobs (jobs that depend on the threshold) or update jobs (jobs that update the threshold). Depending on your selection, an array of job nodes will display in the panel. These can then be sorted by name, date, or schedule path. To add jobs in the panel to the diagram, simply click on the left arrow next to the job or click on the job. The job will be added to the diagram and associated with the threshold. Note that if a job has already been added to the diagram, it will appear grayed out in the panel and cannot be selected.
- Selecting then right-clicking on a resource dependency in the PERT diagram while in Progressive Discovery mode will display the Selection panel. Once the panel is displayed, you have the option to look up and dynamically add dependent jobs (jobs that depend on the resource) or update jobs (jobs that update the resource). Depending on your selection, an array of job nodes will display in the panel. While both dependent and update jobs in the panel can be sorted by name, date, or schedule path, dependent jobs can also be filtered to display only the jobs that currently use that resource (as well as all jobs that are dependent upon but have not yet used the resource). To add jobs in the panel to the diagram, simply click on the left arrow next to the job or click on the job. The job will be added to the diagram and associated with the resource. Note that if a job has already been added to the diagram, it will appear grayed out in the panel and cannot be selected.
Select the Export button to save the current view (i.e., what is currently displayed on the screen) locally to your machine as a PNG file.
To export the entire PERT representation, ensure that everything is captured on screen by using the zooming options.
PERT View Dependency Lines
In PERT View, each dependency type is represented by a different line style and image at the end.
| Requires Failed: By default, a solid red line with arrow indicates a Requires Failed dependency. The job on the end with the arrow pointing towards it (the selected job) has the "Requires" dependency on the job where the line starts (the dependent job). In other words, the dependent job is the job that the line begins and the selected job is the job to which the arrow points. The dependent job must exist in the Daily tables and must fail after executing before the selected job will run. If the dependent job is not on a schedule in the Daily tables, then the selected job will not execute unless it is overridden. | |
| Requires Finished OK: By default, a solid green line with arrow indicates a Requires Finished OK dependency. The job on the end with the arrow pointing towards it (the selected job) has the "Requires" dependency on the job where the line starts (the dependent job). In other words, the dependent job is the job that the line begins and the selected job is the job to which the arrow points. The dependent job must exist in the Daily tables and must complete successfully before the selected job will run. If the dependent job is not on a schedule in the Daily tables, then the selected job will not execute unless it is overridden. | |
| Requires Ignore Exit Code: By default, a solid black line with arrow indicates a Requires Ignore Exit Code dependency. The job on the end with the arrow pointing towards it (the selected job) has the "Requires" dependency on the job where the line starts (the dependent job). In other words, the dependent job is the job that the line begins and the selected job is the job to which the arrow points. The dependent job must exist in the Daily tables. The selected job will run when the dependent job completes, regardless of the exit status. If the dependent job is not on a schedule in the Daily tables, then the selected job will not execute unless it is overridden. | |
| After Failed: By default, a dashed red line with arrow indicates an After Failed dependency. The job on the end with the arrow pointing towards it (selected job) has an "After" dependency on the job where the line starts (dependent job). In other words, the dependent job is the job that the line begins and the selected job is the job to which the arrow points. If the dependent job is in the Daily tables, then the selected job waits until the dependent job fails to complete successfully. If the dependent job is not on a schedule in the Daily tables, then the selected job runs without waiting for that dependent job. | |
| After Finished OK: By default, a dashed green line with arrow indicates an After Finished OK dependency. The job on the end with the arrow pointing towards it (selected job) has an "After" dependency on the job where the line starts (dependent job). In other words, the dependent job is the job that the line begins and the selected job is the job to which the arrow points. If the dependent job is in the Daily tables, then the selected job waits until the dependent job completes successfully. If the dependent job is not on a schedule in the Daily tables, then the selected job runs without waiting for that dependent job. | |
| After Ignore Exit Code: By default, a dashed black line with arrow indicates an After Ignore Exit Code dependency. The job on the end with the arrow pointing towards it (selected job) has an "After" dependency on the job where the line starts (dependent job). In other words, the dependent job is the job that the line begins and the selected job is the job to which the arrow points. If the dependent job is in the Daily tables, then the selected job waits until the dependent job completes, regardless of the exit status. If the dependent job is not on a schedule in the Daily tables, then the selected job runs without waiting for that dependent job. | |
| Excludes: By default, a solid orange line with X indicates an Excludes dependency. The job on the end with the X on it is excluded by the job where the line starts. | |
| Conflict: By default, a dashed purple line with a circle indicates a Conflict dependency. The job on the end with the circle has a "Conflict" dependency with the job where the line starts. The job with the circle on it will not run if the job at the beginning of the line (without the circle) is running. | |
| Resource Dependency: A solid gold line with arrow indicates a Resource dependency. The job on the end with the arrow pointing towards it has a requirement for the resource where the line starts. | |
| Threshold Dependency: A solid brown line with arrow indicates a Threshold dependency. The job on the end with the arrow pointing towards it has a dependency on the threshold where the line starts. |
PERT View Search
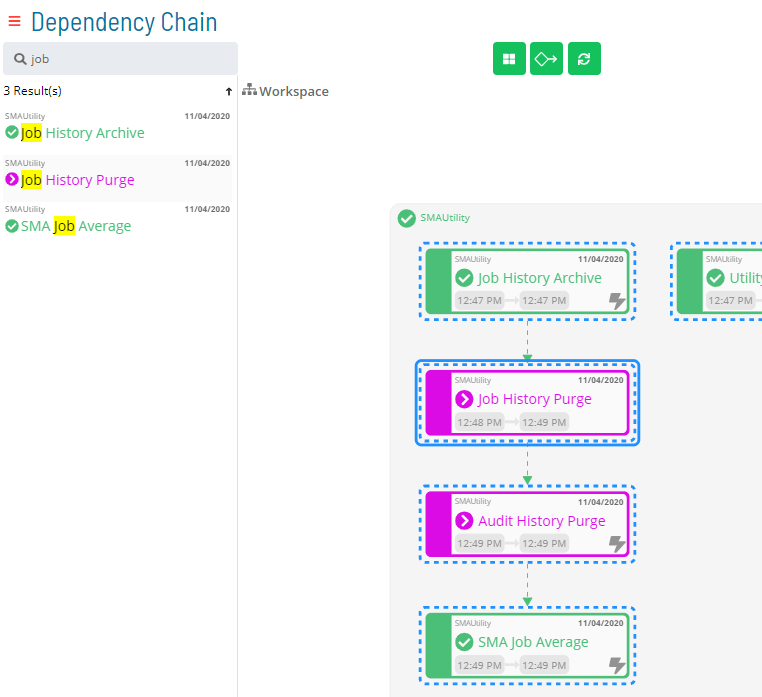
The Search bar in the top-left corner of the page allows you to search jobs in the PERT View. Any keyword(s) or pattern can be entered as search criteria and the results are returned just below the search bar with the matching keyword(s) highlighted. You can then click on any job returned in the search results to navigate directly to that job in the PERT diagram.
Wildcards are supported in the search criteria. Standard wildcard characters include the asterisk (*) for any characters and the question mark (?) for a single character substitution.
PERT View Job Status Updates
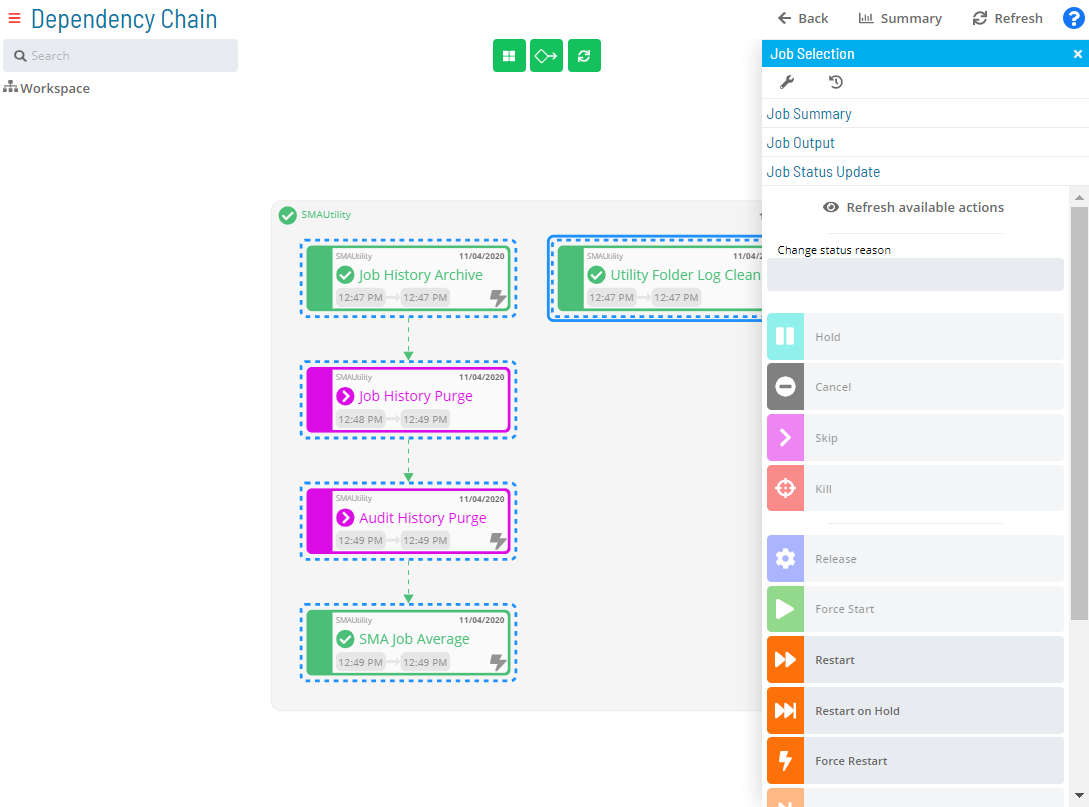
In addition to performing job status changes in the Processes page, job status updates can be performed within PERT View. You can either use your mouse to select a single job or simultaneously press the Ctrl key and your mouse to select several jobs in the PERT diagram. A solid royal blue border appears around any selected job.
Once selected, right-click on the mouse to display the Selection panel with the Job Status Update tab in focus, as shown in the graphic. From there, follow Steps 6 - 9 of the Performing Job Status Changes topic to change the job status of the selected job(s) in the diagram.
PERT View Job Output Requests
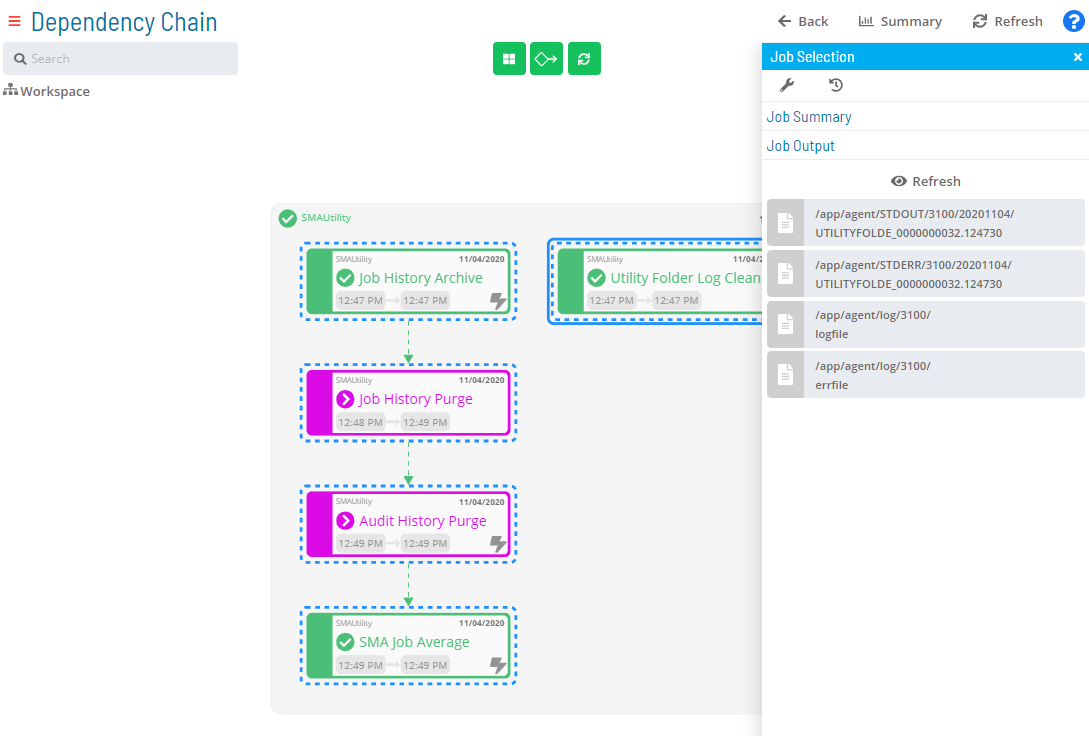
As can be requested in the Processes page, job output files can be retrieved in the PERT View for a job that is completed or has started, is neither a NULL nor Container job, and does not have a status of Waiting, On Hold, Cancelled, Missed Start Time, or Skipped.
In the PERT View, use your mouse to select a single job in the diagram then right-click on the mouse to display the Selection panel. Keep in mind that a solid royal blue border will appear around the selected job. From there, select the Job Output accordion-style tab in the panel, as shown in the graphic, then follow Steps 5 - 9 of the Viewing Job Output topic to request the job output file(s).
PERT View Job Summary Access
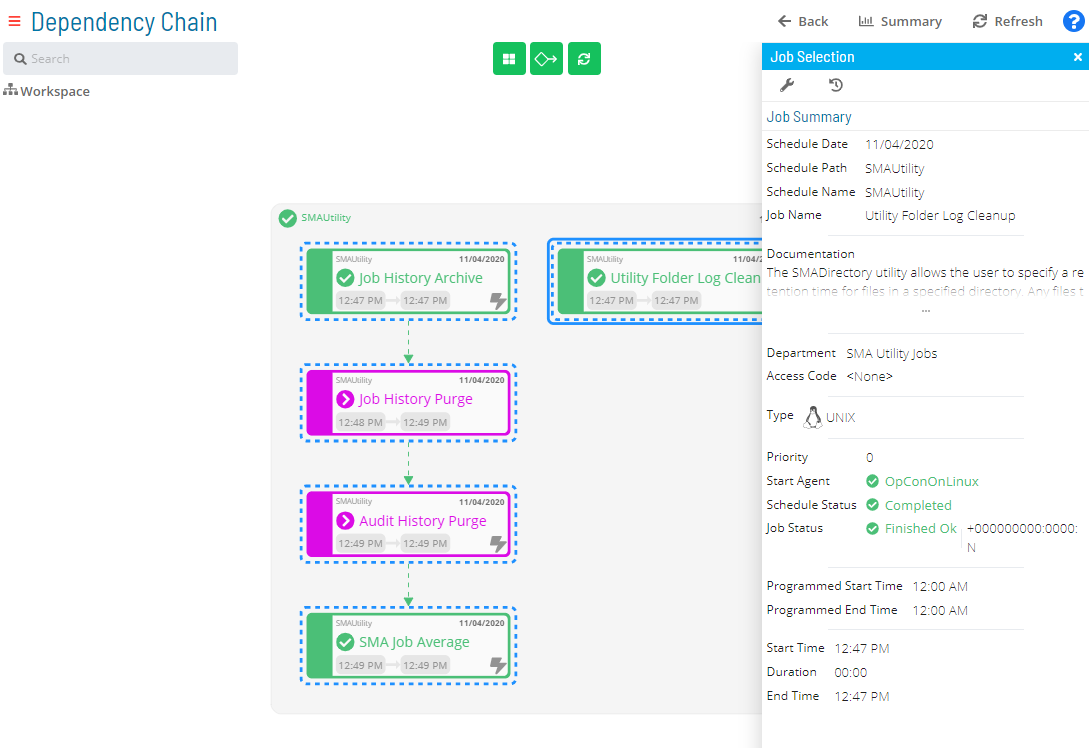
In addition to being accessible from the Processes page, the Daily job summary can also be viewed in the PERT View.
In the PERT View, use your mouse to select a single job in the diagram then right-click on the mouse to display the Selection panel. Keep in mind that a solid royal blue border will appear around the selected job. From there, select the Job Summary accordion-style tab in the panel, as shown in the graphic. For more information about the job summary fields and options, refer to the Accessing Job Summary topic.
PERT View Daily Job Definition Access
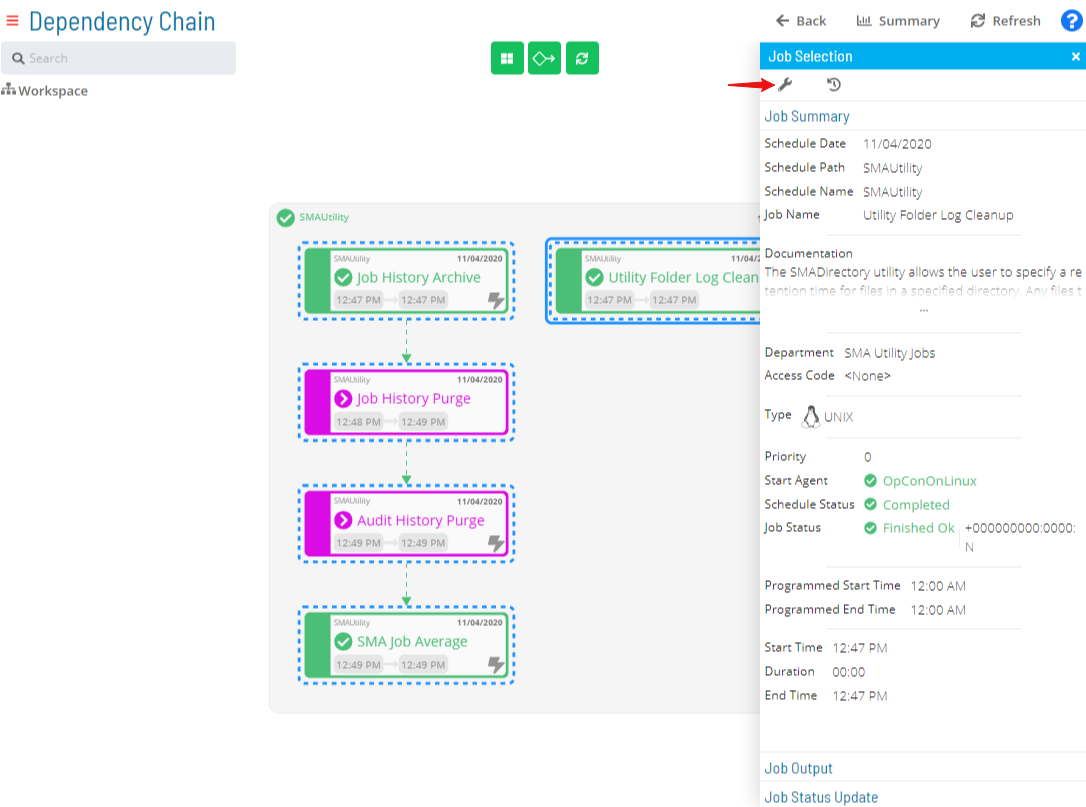
Job configuration can be accessed in the PERT View in addition to accessing it from the Processes page.
In the PERT View, use your mouse to select a single job in the diagram then right-click on the mouse to display the Selection panel. Keep in mind that a solid royal blue border will appear around the selected job. At the top-left corner of the panel, click the Daily Job Definition button, as shown in the graphic. For more information about how to reconfigure job properties, refer to the Accessing Daily Job Definition topic.
PERT View Job Executions History Access
In addition to accessing job executions history from the Processes page, it can also be accessed in the PERT View.
In the PERT View, use your mouse to select a single job in the diagram then right-click on the mouse to display the Selection panel. Keep in mind that a solid royal blue border will appear around the selected job. At the top-left corner of the panel, click the Job Executions History button, as shown in the graphic. The Job Executions History page will display. Refer to the Accessing Job Executions History topic to learn more about the options on this page.

PERT View Schedule Status Updates
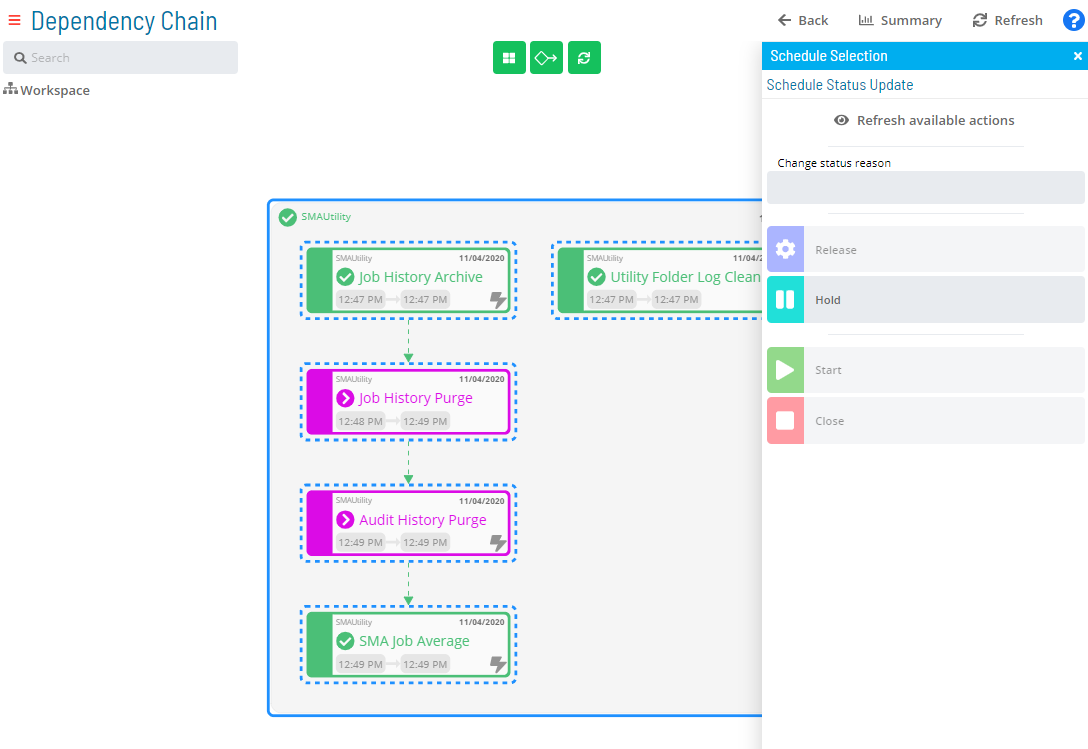
In addition to performing schedule status changes in the Processes page, schedule status updates can be performed within PERT View. You can either use your mouse to select a single schedule or simultaneously press the Ctrl key and your mouse to select several schedules in the PERT diagram. A solid royal blue border appears around any selected schedule.
Once selected, right-click on the mouse to display the Selection panel with the Schedule Status Update tab in focus, as shown in the graphic. From there, follow Steps 6 - 9 of the Performing Schedule Status Changes topic to change the schedule status of the selected schedule(s) in the diagram.
PERT View Bulk Job Status Updates (Schedule Level)
As can be performed in the Processes page, mass action on job status updates at the schedule level can be performed within PERT View. You can either use your mouse to select a single schedule or simultaneously press the Ctrl key and your mouse to select several schedules in the PERT diagram. A solid royal blue border appears around any selected schedule.
Once any schedule is selected, right-click on the mouse to display the Selection panel. You will then need to select the Bulk Job Status Update accordion-style tab in the panel, as shown in the graphic. From there, follow Steps 6 - 9 of the Performing Bulk Job Status Updates (Schedule Level) topic to perform bulk job status updates for the selected schedule(s) in the diagram.
inPERT-5d26ddc2fb79047e3a364f0f29934ba9.png)
Related Topics