Viewing Vision Health
Vision Health allows you to view a dashboard of the historical data for completed Vision cards. Additionally, the Vision Health page provides a high-level view of the data represented from the Operations module. For more information on the Operations module, refer to Working with Operations in the Solution Manager online help.
Vision Health Page

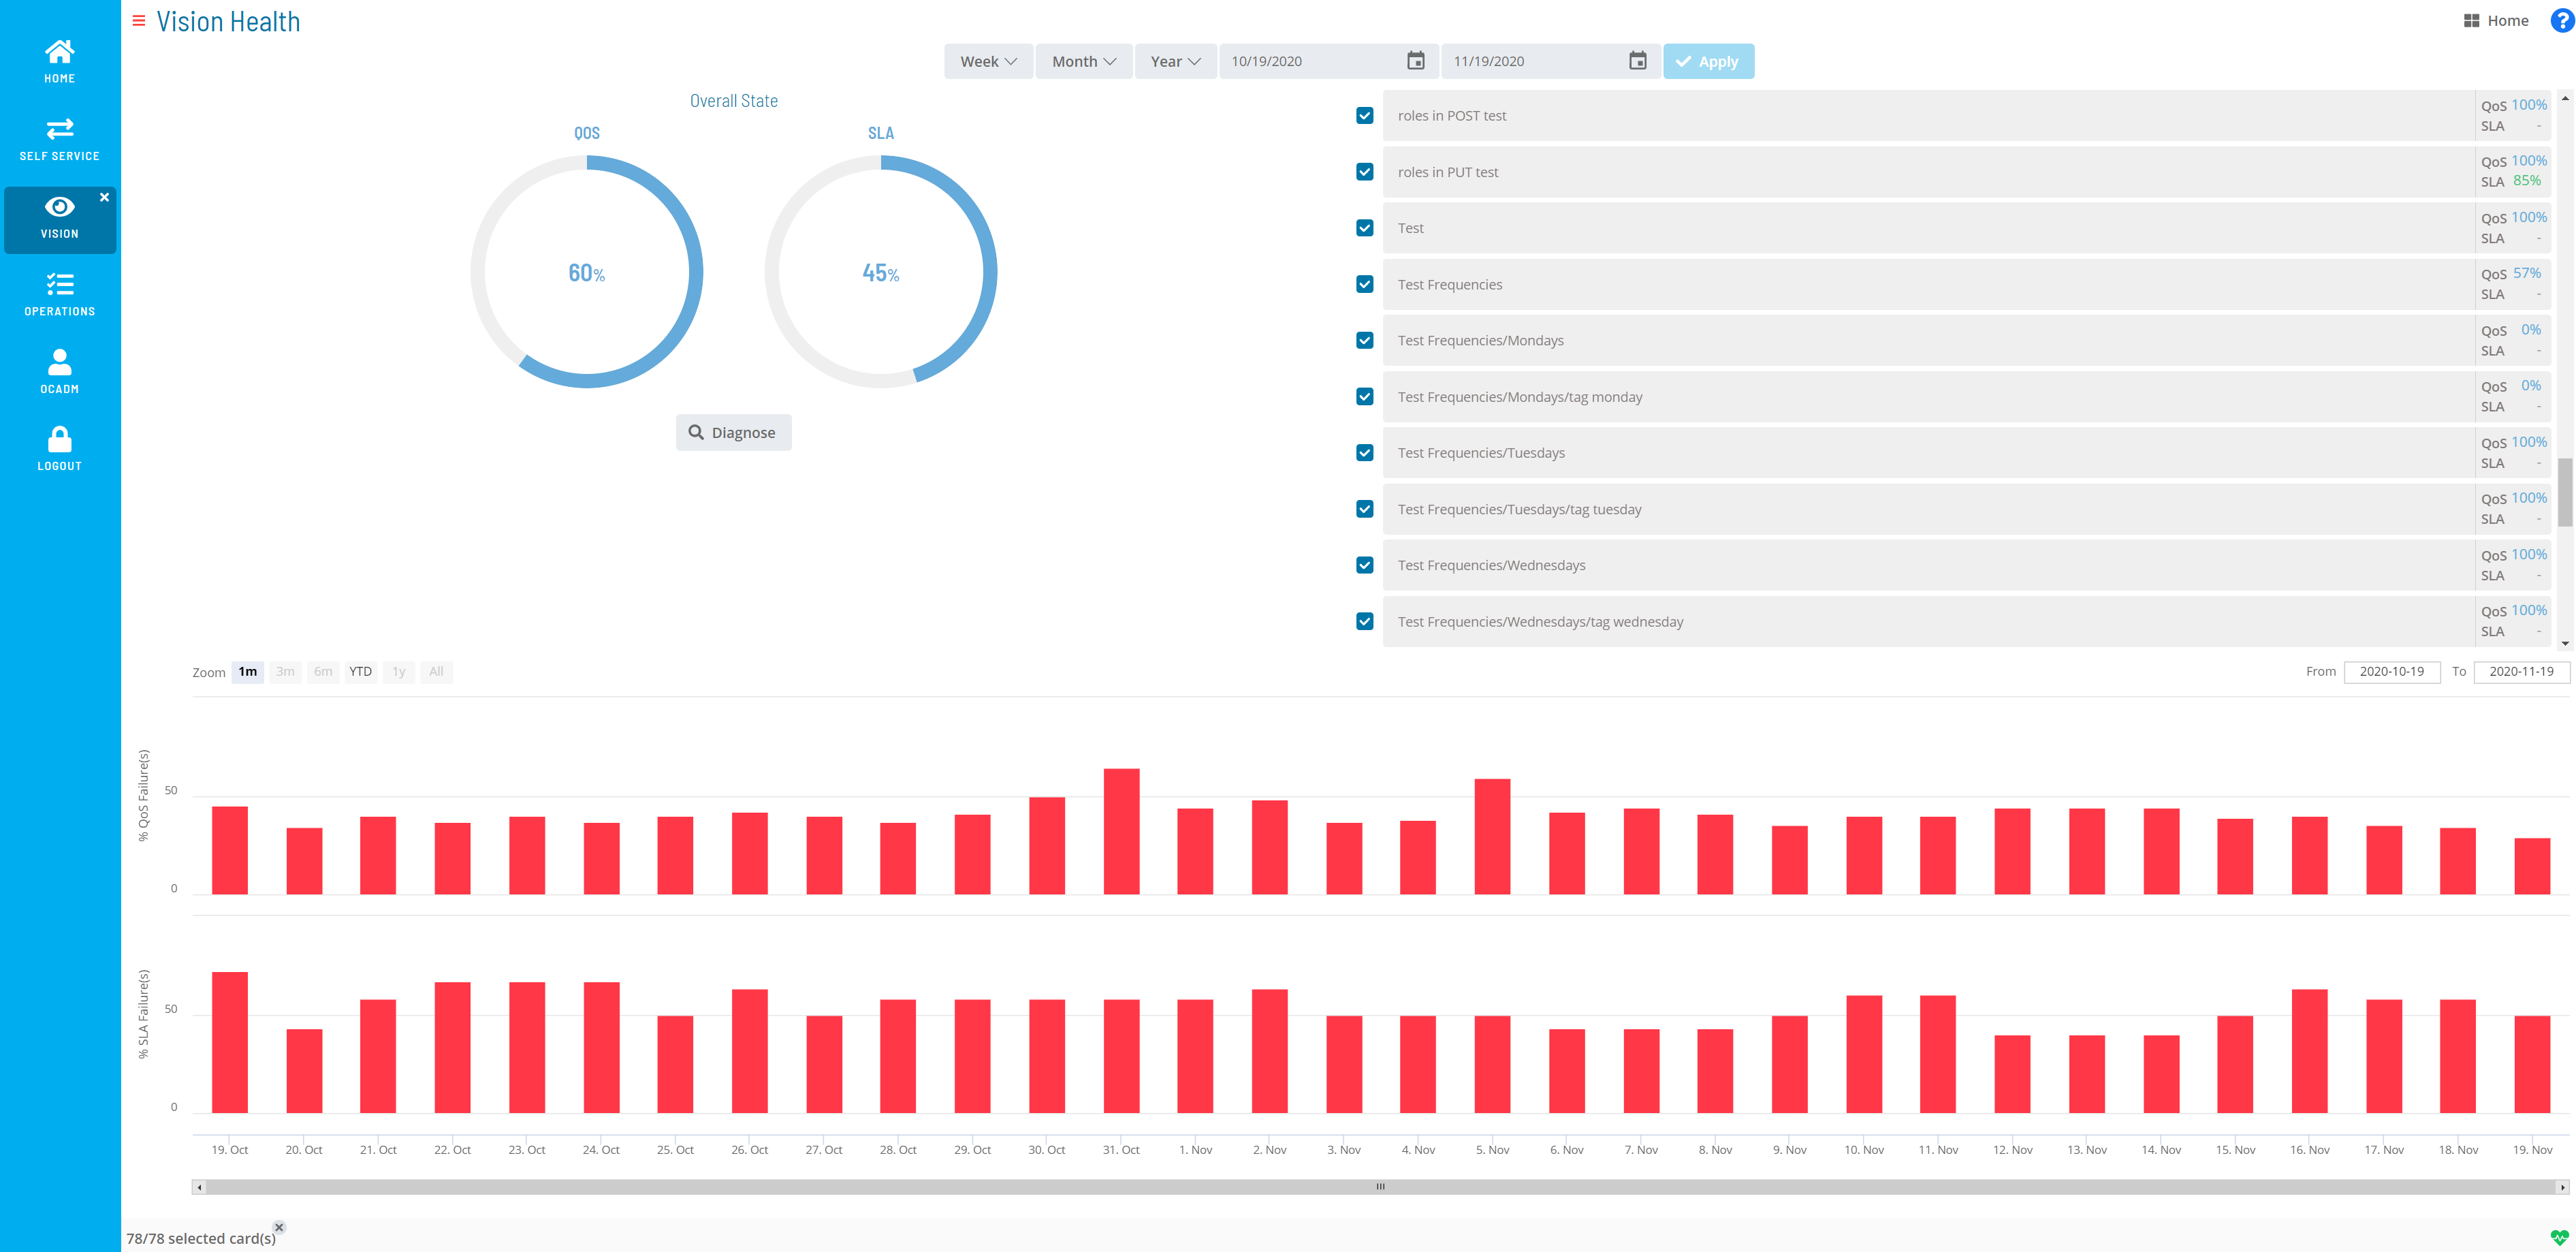
The health summary includes a quantitative summary of the performance of completed cards and their associated job data. There are two views of data: the QoS (Quality of Service) and the SLA (Service Level Agreement). These views display the summary rates of the QoS and SLA for a selected Vision card during a selected period plus the associated details.
An administrator user can set thresholds, a critical level and a tolerable level, on cards for both QoS and SLA. For more information on thresholds, refer to Managing Vision Settings in the Solution Manager online help.
- Overall State/Partial State: Displays a summary of the
operational health based on selected cards (which are listed to the
right) and their associated QoS and SLA over a selected period. By
default, all cards are selected, which provides an overall health
summary.
- QoS: Defines, as a percentage, a measure of the number of times jobs have completed successfully. By default, an average of the QoS for all cards is displayed.
- SLA: Defines, as a percentage, a measure of the number of times jobs have completed within the defined SLAs. By default, an average of the SLA for all cards is displayed.
- Diagnose: This button navigates to the Vision Diagnostic page, which provides additional details on anomalies.
- Week: Allows you to filter the data by week.
- Last: Filters the data to display the last week, defined as the previous Monday through Sunday.
- Sliding: Filters the data to display the last seven days, including the current day.
- Month: Allows you to filter the data by month.
- Last: Filters the data to display the last month, defined as the last named calendar month.
- Sliding: Filters the data to display the last calendar month (28-31 days), including the current day.
- Year: Allows you to filter the data by year.
- Last: Filters the data to display the last full year prior to the current year.
- Sliding: Filters the data to display the last 365 or 366 days, including the current day.
- Calendar: Defines the date range. The dates can be manually selected using the calendar tool, manually entered in the date field, or automatically defined by selecting a Week, Month, or Year option.
- Apply: This button applies manually-defined dates.
- Zoom: This filter will zoom in the data to the following ranges:
- 1m (1 month)
- 3m (3 months)
- 6m (6 months)
- YTD (Year to date)
- 1y (1 year)
- All
- From: Defines the starting date represented in the % QoS Failure(s) and % SLA Failure(s) frames.
- To: Defines the ending date represented in the % QoS Failure(s) and % SLA Failure(s) frames.
- % QoS Failure(s): Defines the percentage of QoS failures for the date range specified.
- % SLA Failure(s): Defines the percentage of SLA failures for the date range specified.
Vision Diagnostic
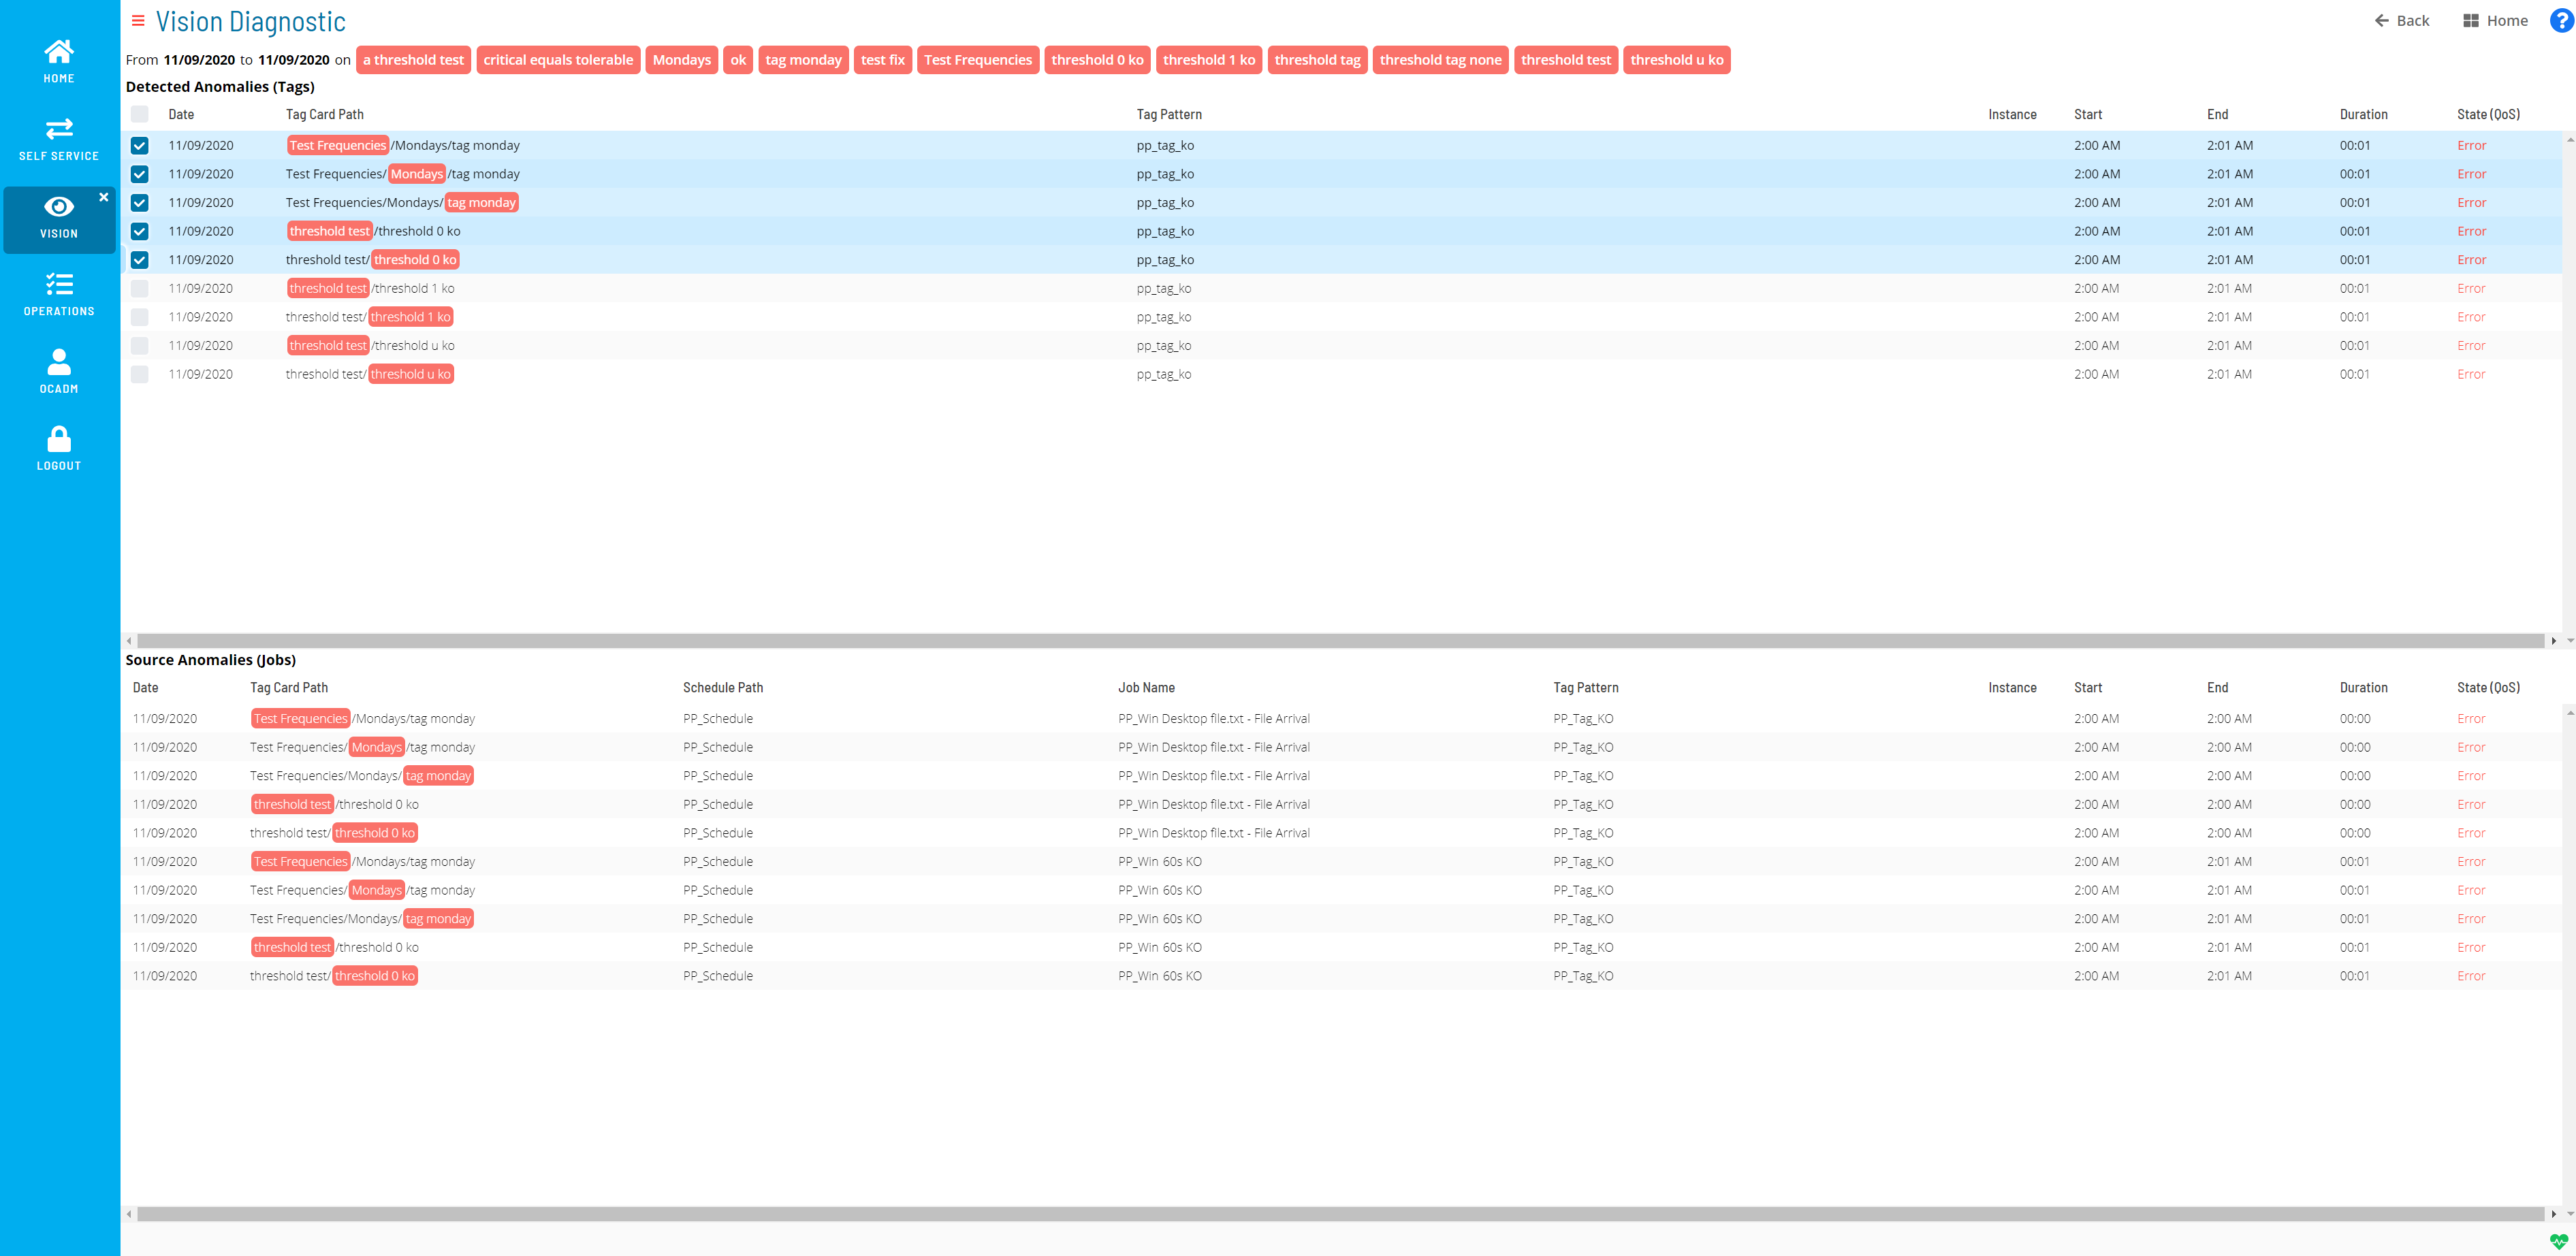
The Vision Diagnostic page allows you to find information on what caused an anomaly. The diagnosis takes the context of the date range defined from the Vision Health page combined with the cards selected in the Detected Anomalies (Tags) section and searches for the root cause(s) of the health issues (i.e., what caused a low QoS percentage or caused an SLA to fail meeting its criteria).
Vision Diagnostic Page

From [Date] to [Date] on [Tag]: Defines the date range specified on the Vision Health page for the listed card pattern (tag).
Detected Anomalies (Tags): This frame lists the tag-related data for detected anomalies.
- Date: Defines the date the anomaly was detected.
- Tag Card Path: Defines the card path.
- Tag Pattern: Defines the pattern (tag) defined for the card.
- Instance: Defines the remote instance (if any) defined for the card.
- Start: Defines the start time for the card.
- End: Defines the end time for the card.
- Duration: Defines the duration of time the card ran.
- State (QoS): Defines the state of the card.
Anomalies Source (Jobs): Defines the job-related details for the tag(s) selected in the Detected Anomalies (Tags) frame.
- Date: Defines the date the anomaly was detected.
- Tag Card Path: Defines the card path.
- Schedule Path: Defines the schedule path for the job(s) associated to the card.
- Job Name: Defines the job name associated to the card.
- Tag Pattern: Defines the pattern (tag) defined for the card.
- Instance: Defines the remote instance (if any) defined for the card.
- Start: Defines the start time for the job.
- End: Defines the end time for the job.
- Duration: Defines the duration of time the job ran.
- State (QoS): Defines the state of the job.
Vision Health Colors
Vision Health uses colors for the QoS and SLA charts and percentages that dynamically change based on the threshold levels set for a card. For more information on thresholds, refer to Managing Vision Settings in the Solution Manager online help.
Vision Health uses the following color indications:
- Green: The threshold level set for the card is good.
- Orange: The threshold level set for the card is tolerable.
- Red: The threshold level set for the card is critical.
- Blue: The threshold level set for the card is unknown. There are no thresholds set or there are multiple values within the selected time period.
The colored bullets are indicators that a card is selected and have nothing to do with thresholds.