Using Workflow Designer
The Workflow Designer has three main elements: display area, action panel, and toolbar.
Workflow Designer Display Area
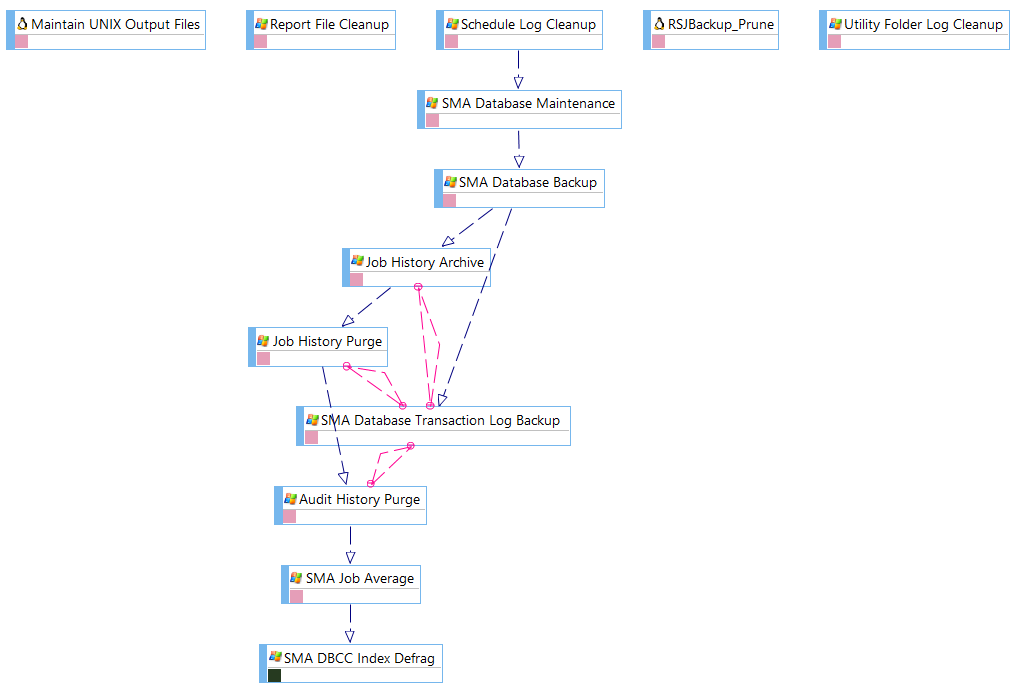
The display area provides the graphical display and workflow (also referred to as a flow diagram or flow map) for a selected schedule. Each node on the layout represents a job (rectangle), threshold (rounded rectangle), or resource (oval). The lines between nodes represent their dependency relationships. The interface provides the ability to drag and drop dependencies for jobs, thresholds, and resources as well as provides right-click functionality for nodes and dependency lines.
Example Flow Diagram

Workflow Designer Action Panel
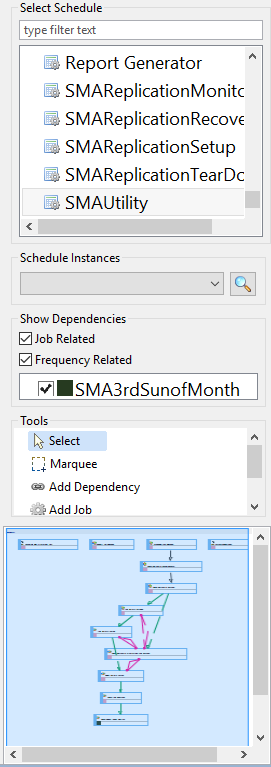
The action panel, to the right of the display area, contains a list of schedules and subschedules with different layout choices for viewing the job dependency relationships. Specific diagram tools are also provided in the panel to add jobs and dependencies, and select thresholds and resources to add to the display. The lower portion of the panel displays a small map of the entire schedule to provide easier navigation to the different clusters of information in the display.
Workflow Designer Action Panel
Workflow Designer Toolbar
The toolbar resides at the top-right corner of the screen and allows you to perform various functions. Click on any specific icon or control on the toolbar below to learn more about its functionality.
![]()
Related Topics
- Understanding Flow Diagram Icons
- Understanding Dependency Lines
- Using Right-Click Menus
- Displaying Schedule Layouts
- Displaying Schedules showing Job-Related/Frequency-Related Information
- Adding New Schedules
- Adding Jobs to Schedule Layouts
- Adding Thresholds to Layouts
- Adding Resources to Layouts
:::
